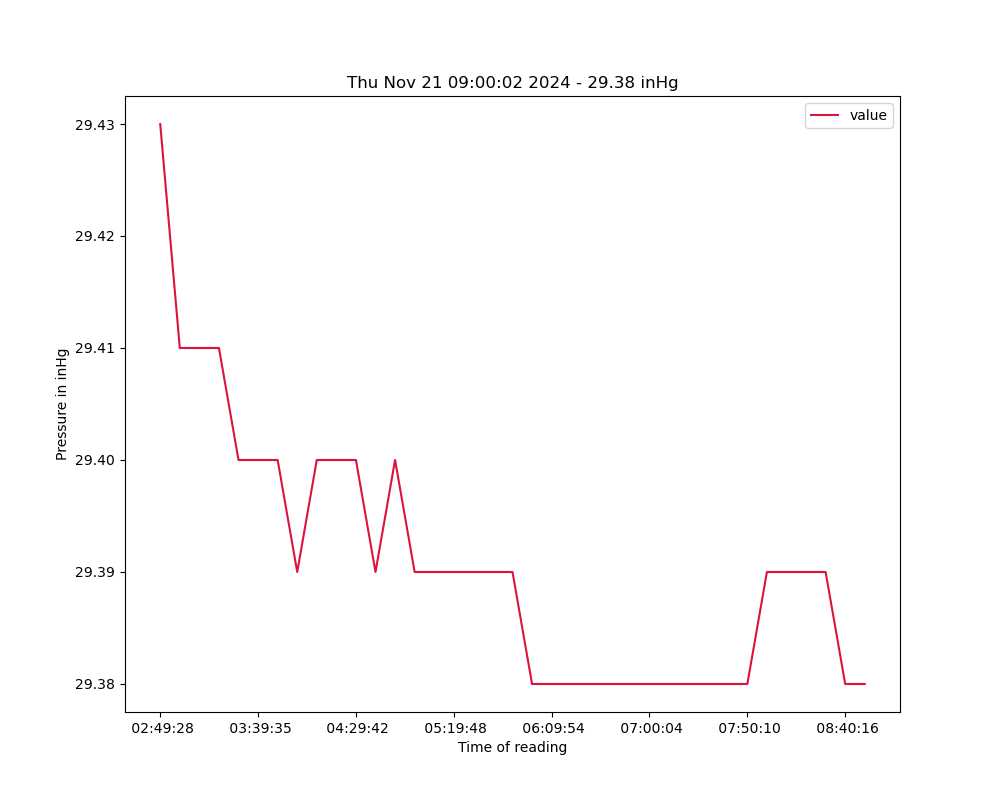
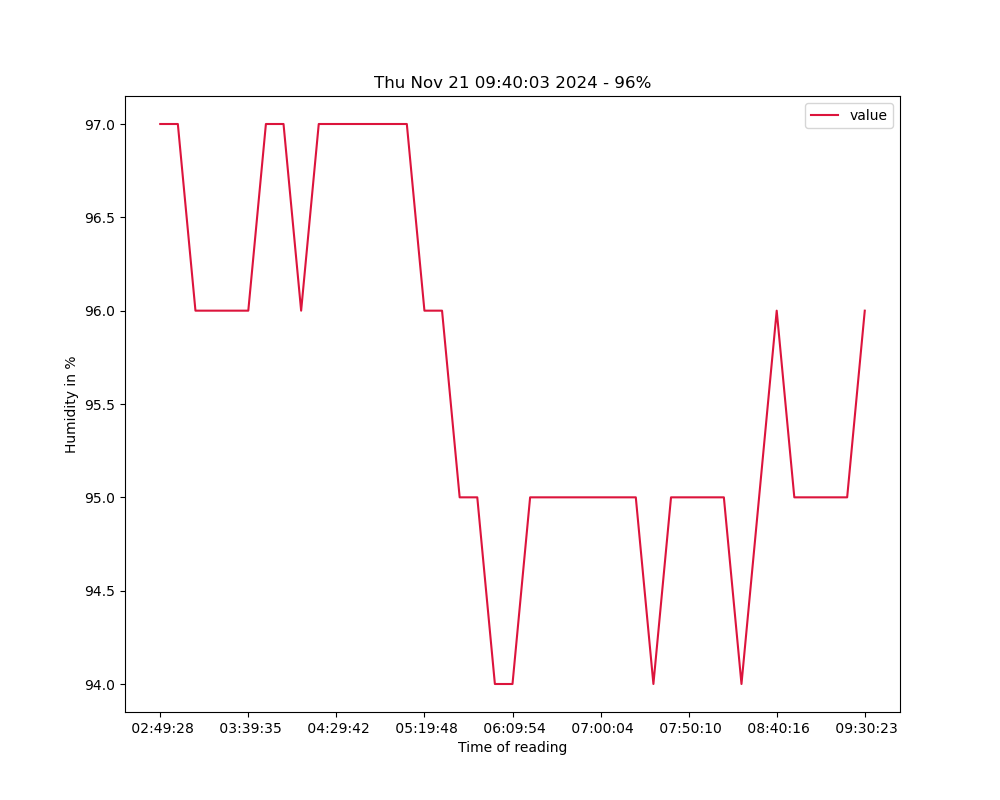
Overview (Scroll down for specifics)
 |
 |
 |
 |
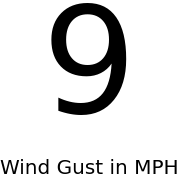
Wind Gusts in MPH: 9
| Todays recorded High and Low Temperature |
Break out charts


How it works:
At midnight a cron job kills the running daemon and removes the nohup.out file
Next cron runs a script to move off the old images and data files to an archive
Then the daemon is restarted which polls the Weather Underground API every 5 minutes to get the data from the weather station on the back of The Shanty
The script then parses the JSON and collects the current Temp, Pressure, Humidity and Wind Speed and adds them to a csv that accumulates over the course of the day.
Every 10 minutes a Python script kicks off that, using pandas and matplotlib.pyplot regenerates the graphs and places them out on the web server.
Here’s the code on my GitHub


